The Boulder BI Brain Trust


February 2009 Archives

ChartSearch Extends Corporate BI with Google for Data

| | TrackBacks (0)
ChartSearch logo.pngChartSearch presented an overview of their company and product, with Chris Modzelewski, founder and CEO presiding. Chris summed up his product as the "Google for Data". Tagline is "better leverage available data throughout the enterprise". Chris has been working on product for three years and started in April to talk with clients. He has eight beta customers in pilot projects, some of which are close to production applications with ChartSearch.

The company is targeting enterprise IT shops and OEM partnerships with data providers and software analysis vendors. He is currently focusing on the latter with the ability to brand ChartSearch for those providers/vendors using Java web services.ChartSearch room.jpg

Chris emphasized that his product complements (not replaces) traditional BI tools by extending data analytics to nontechnical business users.

Depending on data complexity, installation requires anywhere from two days to two weeks. In collaboration with the IT group, the relevant metadata is specified in the Data Search Markup Language (DSML) and is used to drive the search procedures and chart generation.

Chris gave a great demo of ChartSearch. It has nice features for translating confusing requests from a business user into precise queries to the database. It generates multiple interpretations, ranked in order of relevance, according to a confidential algorithm .
They are working with eight beta customers in pilot projects. The challenge will be to move them from pilot to production and start some revenue flowing to ChartSearch.

We ended with an in-dpeth discussion of business strategies about whether Chris should focus on partnering with SaaS vendors. Since these vendors already have defined the metadata level, the ChartSearch could be an easy enhancement for those SaaS tools.

ChartSearch is a company to watch as it matures its product and grows its customer base. It is a likely evolutionary step for traditional BI tools in furthering the pervasiveness of analytics throughout the enterprise.  
ChartSearch logo.png


Chris Modzelewski, Founder/CEO of ChartSearch came to see the Boulder BI Brain Trust and explain why ChartSearch can be Google for your Data.

ChartSearch sees its opportunities in the market in between two segments, the Enterprise Search providers and the conventional Business intelligence solution providers. The product has been in the market since April of 2008. The company spent 3 year building the technology.

They see themselves as a supplement to more conventional BI solutions doing analysis where these companies may struggle. They don't search unstructured data they excel in the world of search over structured data that can be represented numerically. The difference between ChartSearch and companies that are in the Enterprise search world  is that they understand search but also bring the data analysis part putting them between the unstructured search suppliers and what a conventional BI suite does.The issue with Enterprise Search is that many solutions tried to offer it as a replacement to BI but it fails in the analysis arena. No drill down, no ah-ha moments just a directory of stuff ChartSearch combines both search and analytics.

The tricky part for ChartSearch is making sense of the meta data layer so they can apply the right data to the query. They do have a solid four step process for both automating the process as well as expected manual interfaces to provide access and constructs around the meta data.

I found myself wondering if ChartSearch could supply the answer for the growing question around serving the needs of new and up and coming data/knowledge workers who demand access to information through an interface that makes them comfortable such as a search interface.

Overall I am impressed with what they are doing and the niche between enterprise search and standard business intelligence is greatly undeserved.

Actuate Pushing Sustainability Smarts

| | TrackBacks (0)
Actuate logo.jpgActuate Corporation give us an update on their products and future trends, along with their new initiative into sustainability analytics. Presenting Nobby Akiha, Senior Vice President of Marketing, Kapil Kedar, Product Marketing Manager, Jeff Morris, Director, Product Marketing, and Mark Gamble, Senior Technical Marketing Manager.

The company is headquartered in San Mateo and has 4,400 customers across finance services (ouch!), government, health care, education and utilities. They generated $131M during FY08, of which $40M in licenses and $70M in maintenance. This is down from $141M the prior year.
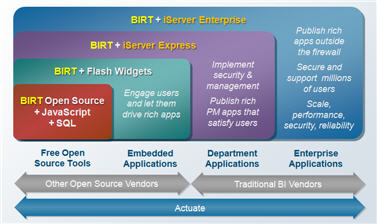
actuate products.jpgAkiha gave an overview of the company, using this key slide showed the spectrum of products and services from Actuate. The lower left is BIRT (the plain free open-source version) that can be used by corporations or by software developers to offer commercial products. Next to the right, BIRT can be enhanced with Flash widgets, a for-fee product. Then to the right, Actuate offers the usual departmental and enterprise software.

We got into an interesting discussion revolving around their strategy/partnership with their BIRT open source community. What is the balance between Actuate revenue potential versus BIRT community health? It is a dicey strategy for a software vendor, since community could be competing with Actuate.

Kedar gave a demo, remarking, "Actuate reports go out to many, many users. It is very scalable and web-centric." Cool demo! Lots of charts, widget, animations... Evolved into interactive reporting where we do not know the question to ask. Saw a javascript code to bring in widget into any web page, such as this blog. They promised a sample widget for me to insert HERE...

Morris explain Actuate's approach to Sustainability Management as being able to 'maintain' your sustainable business in three areas: environmental responsibility, economic prosperity, social equity. The product suite consists of over 100 metrics in carbon footprint, facility energy consumption, and so on. Impressive! Lots of thought about how to capture a broad spectrum of sustainabiltiy factors.


This page is an archive of entries from February 2009 listed from newest to oldest.

January 2009 is the previous archive.

March 2009 is the next archive.

Find recent content on the main index or look in the archives to find all content.