The Boulder BI Brain Trust


November 2009 Archives

WhereScape Builds DW Fast

| | TrackBacks (0)
WhereScape logo.pngMichael Whitehead, CEO and founder, Mark Budzinski, VP/General Manager, and Chuck Kelley, Senior Data Warehouse Architect, all from WhereScape USA. Also attending is Scott Humphrey, CEO of Humphrey Strategic Communications. They are seeking advice on positioning, market segments to target, and future directions.

On a faded piece of paper posted on the office wall, Michael listed the questions that he NEVER wants to hear from customers. This is a nice way of institutionalizing the company's mission statement!

Michael reviewed the company history transitioning from a consulting firm to a software product company in 2004. Focused on SQL Server, then Teradata, Oracle, and recently IBM DB2. Currently, WhereScape has approximately 350 customer of which 150 in the US. Average cost of purchasing the WS product is around $75,000, which is roughly set at one FTE. So, the business justification is trading off hiring an extra employee or consultant.

Michael continued with their WhereScape arch.png architecture slide, showing how they fit with the vendor's DW components. WhereScape focuses on customers who have no time and no money for building a data warehouse, as characterized in this segmentation slide.

Unrelated historical note: 1840 is considered a watershed year in the history of New Zealand: The Treaty of Waitangi is signed, British sovereignty over New Zealand is proclaimed, organized European settlement begins, and Auckland and Wellington are both founded.

Michael covered several customer situations: Subway, City of Lakewood Colorado, Vodafone, and Ross Systems. And then, Cluck started the demo of WhereScape Red into adding a State column to an existing table. Impressive in the level of detail and in the ability to escape from the tool's suggestions. We then immersed into a discussion of product futures and market directions, all under NDA.

My Take... WhereScape has an established product that can build DW quickly. However, it is apparent that the user must have reasonable data analysis skills. And if true, this tool is definitely a productivity enhancer.

There is an opportunity for WhereScape to embody "best practices" in DW development. They do have a Community forum to assist customers in their learning and to contribute to the community's best practices. Then, WhereScape can take advantage of this evolving best practice as ideas for future product enhancements.

WhereScape is here today

| | TrackBacks (0)
WhereScape logo.pngMichael Whitehead CEO and Founder, Mark Budzinski VP & GM USA, Chuck Kelley Senior Data Warehouse Architect and our good friend Scott Humphrey from Humphrey Strategic Communications have joined us in Boulder today and the BI Trust is present in force with members from South Africa, Netherlands, UK and the USA all attending today. A little background on WhereScape, the company started in 2004 they have 350 clients and the largest concentration is US based firms which speaks well of a New Zealand based company.The mantra at WhereScape drives the creation of their software.

"Pinned to the wall in our founder's office is an old piece of paper.  It's faded and tatty, but for us at WhereScape it's a kind of manifesto.

Scribbled on this paper are the four things that WhereScape founder Michael Whitehead said he never wanted to hear again from a customer..."

scrappy_paper.JPG


One of the compelling advantages to a product like WhereScape is its ability to to do rapid delivery, "rapid marting" or even throw away data marts. The ability to prototype as your needs evolve is generally a costly and time consuming effort that a solution like WhereScape can produce positive ROI on its first project. While it wasn't necessarily designed for prototyping its a great advantage of the product. Bottom line WhereScape is designed to build data warehouses faster than the competition.

During the demo I felt the interface was quite intuitive and simple especially for a data warehouse professional. It offers built in best practices and a ton of built in time savings suggestions and guidelines. But as most DW experts will want is the opportunity to write SQL from scratch and add custom rules and processes. It tracks changes and creates documentation automatically on the fly. (by the way its big fun watching an expert like Chuck Kelley run a demo like this he's way smarter than me!)

The need to consolidate DW's, create new versions, support evolving BI needs, support new applications are all valid reasons to look at a solution like WhereScape the power is in the speed and ease of use.


BIS2Logo.JPGIntroduction:
Today Mukesh Gordhan (CEO) and Andrew Cardno (CTO) of BIS2 joined the BBBT for a look at their vizbybis2 product and the various visualization features that  BIS2 offers.  We covered: Customer Stories; Product Offerings, Architecture and Demos; and Partner Arrangements.

Some of this was under NDA....  Some not....

Data Visualization vs Data Analysis:
The BIS2 approach to tackling the "hard" visualizations and providing "quick" information for a particular vertical should be applauded.  Having cut their teeth in the 'gaming industry' ( ...read las vegas where time literally is money... ); BIS2 has a significant history in not just visualizing data into a graphic/meter, but making that graphic/meter meaningful to the user in a quick amount of time.  BIS2 does this using their Super Graphics bundled for particular industry verticals where large amounts of data and time sensitivity easily overwhelm traditional data visualization tools/toolsets.

In this BIS2 is a data visualization tool/toolset.  However, the analysis capabilities of the BIS2 Super Graphics pushes the definition of data visualization...

Data Analysis Capabilities:

WOW!  I must say that level of information provided in the BIS2 Super Graphics is amazing.  My personal favorite was the temporal presentation "super graphic".  This cross between a heat map and a pie chart ( ...and that's in no way doing justice to the information being communicated... ) has the ability to condense an entire day, month or year into a "relatively" easy ( ... i will expand on that in a moment... ) read/understand graphic.  Imagine taking all of those hourly stacked bar charts from a day or the daily bar charts from a year and being to instantly compare like time frames and find those areas of interest without all the annoying "scroll bars" to move across the entire data set.
 
BIS2_temporal.gifGranted.... The BIS2 Super Graphics look a little like tie dye colored donuts ( ...in the case of the temporal example to the right.... ) or a Jackson Pollock paintings for some of the other Super Graphics: Spatial, Inspatial, Quartal.  However, to the trained eye, the amount of information being presented is impressive.  You can instantly determine areas of high or low values for the data set and correlate those values based on the appropriate analysis. 
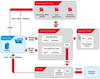
Product Technology:

Significant usage of Flash technology make the end user and development client packages less cumbersome than you might imagine... in particular if you have been using some of the "big vendor" data visualization development toolsets on a regular basis.

Product Portfolio:
BIS2's vizbybiz2 product has an associated family of vertical offerings:

  • retailViz
  • telViz
  • insuranceViz
  • entertainmentViz
  • gameViz
  • manufacturingViz
  • moneyViz
In each of these, they are again tackling the industries where big data and time sensitivity are key to the business model(s).

Double-Black - No Guts! No Glory
BIS2 is a data visualization application.  However, that's like describing a Porsche as "just" a car.... And just as a Porsche isn't exactly for dragging groceries around the planet, BIS2 isn't for simple data visualization exercises or tasks. BIS2 is targeting much more difficult tasks than presenting a single product, single time frame or location.  For the expert ( ...double black diamond for colorado skiers... ) data analysis tasks associated with the high data volume and low data latency industries targeted by the vizbybis2 product suite; I would definitely recommend a look at what BIS2 has to offer.

However, the analysts who use the Super Graphics will need to take the time to appreciate the amount and level of data being presented as they will be challenged to master the new territory.  But like the Double Black Diamond ski slope, it will be well worth the challenge and the effort.


This page is an archive of entries from November 2009 listed from newest to oldest.

October 2009 is the previous archive.

December 2009 is the next archive.

Find recent content on the main index or look in the archives to find all content.